

CONTRIBUTORS

Francis Gannon
Co-Chief Investment Officer, Managing Director, Royce Investment Partners
With the current market consensus that the Federal Reserve (Fed) will be more hawkish regarding rates, a familiar narrative has returned: Rising interest rates are bad for small-cap stocks. The logic is straightforward: Smaller companies are perceived as being more leveraged, more dependent on external financing, and therefore more vulnerable to higher borrowing costs. As a result, the argument goes, when the Fed tightens monetary policy, small caps are destined to underperform.
It's an intuitive argument. It’s just one that history does not support.
As we looked across previous Fed tightening cycles, we found little evidence that higher interest rates consistently translated into weaker small-cap performance. In fact, excluding the most recent tightening cycle—which was heavily influenced by the extraordinary concentration of returns among the “Magnificent Seven”—small-caps have, on average, outperformed large-caps during periods of rising rates. Including the most recent, Magnificent-Seven dominated cycle, leadership becomes more balanced, but the broader conclusion remains unchanged: Rising rates alone have not been a reliable predictor of relative returns between small- and large-caps.
The same pattern was evident historically during easing cycles. Lower interest rates have generally been supportive for equities but have not consistently favored either small- or large-cap stocks. Leadership has shifted from one cycle to the next, suggesting that monetary policy itself has rarely determined market leadership.
If the historical relationship between interest rates and small-cap performance is so weak, why does the perception persist? Part of the answer lies in another widely held assumption—that small-cap companies are broadly overleveraged. In reality, the Russell 2000 Index is far more financially diverse than many investors appreciate.
According to Furey Research Partners, approximately one-third of the companies in the index hold more cash than debt, while nearly half of the index’s total debt is concentrated in companies representing just 12% of its market capitalization. Many small-cap businesses also do not rely on debt as a primary source of capital, instead funding growth through internally generated cash flow, disciplined capital allocation, or equity financing. In other words, investors often speak about the Russell 2000 Index as though it represents a single balance sheet. It doesn't. It represents nearly 2,000 companies with dramatically different capital structures, financial profiles, and competitive positions. Taken together, the historical performance data and financial characteristics of today’s small-cap universe challenge one of the market’s most enduring myths.
So, if interest rates have not consistently explained small-cap performance (and many companies are far less dependent on debt than commonly believed) what does drive small-cap returns?
The answer is remarkably simple: Earnings.
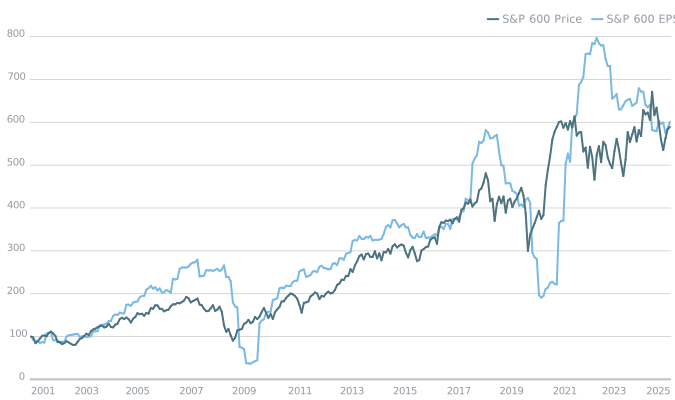
For the purposes of this argument, we looked at data for the S&P SmallCap 600 Index because it requires that companies be profitable for inclusion (among other criteria) and rebalances less frequently than the Russell 2000 Index. The data in the chart below shows that, over the long term the S&P SmallCap 600’s price performance closely tracked the growth in corporate earnings, illustrating that fundamentals—not interest rates—have been the dominant driver of returns.
Earnings Have Primarily Driven Small-Cap Returns
S&P SmallCap 600 Earnings Growth vs. Price Growth, 7/31/01-7/31/25
Source: FactSet. Past performance is no guarantee of future results.
Over the past two decades, stock prices have periodically moved ahead of, or fallen behind, corporate earnings as investor sentiment shifted. Yet over time, prices and earnings have consistently converged. Interest rates can influence valuations and investor sentiment over shorter periods, but long-term returns have ultimately followed the direction of earnings.
This also explains why the relationship between interest rates and small-cap performance has often appeared inconsistent. The Fed typically raises interest rates because economic growth is strengthening and corporate earnings are improving. Conversely, it generally lowers interest rates when growth is slowing, and earnings expectations are deteriorating. In both cases, the earnings outlook, as opposed to the direction of interest rates, has historically been the more important driver of returns.
For investors, we think the implication is straightforward. Rather than asking whether interest rates are moving higher or lower, we think the better, more relevant question is whether corporate earnings are likely to accelerate or decelerate. The temptation during every market cycle is to reduce investing to a single macro variable. Today, that variable is looking more and more like it will be interest rates. History suggests, however, that it may be better to focus on the factors that have consistently driven long-term returns: Earnings growth, balance sheet strength, and business quality. That is particularly true in small-caps, where the opportunity set is exceptionally diverse. Companies differ dramatically in their financial strength, competitive advantages, earnings trajectories, and management teams. Those differences matter far more than broad assumptions about the direction of interest rates.
When investors become fixated on macro narratives, they often overlook the significant differences among individual businesses. That is precisely where active management can add value. By focusing on fundamentals rather than headlines, active managers can identify financially strong companies with growing earnings, sound balance sheets, and durable competitive advantages whose intrinsic value is not yet fully reflected in their share prices. History suggests those distinctions—not the direction of interest rates—have been the more reliable driver of long-term small-cap returns.
Stay tuned…
Definitions
Indexes are unmanaged and one cannot directly invest in them. They do not include fees, expenses or sales charges. Past performance is not an indicator of future results.
The Russell 2000 Index is an index of domestic small-cap stocks that measures the performance of the 2,000 smallest publicly traded US companies in the Russell 3000 Index.
The S&P SmallCap 600® seeks to measure the small-cap segment of the US equity market.
Magnificent Seven refers to a dominant group of seven major mega-cap technology and growth companies in the US stock market: Alphabet, Amazon, Apple, Meta, Microsoft, Nvidia, and Tesla.
WHAT ARE THE RISKS?
All investments involve risks, including possible loss of principal. Past performance is no guarantee of future results. Please note that an investor cannot invest directly in an index. Unmanaged index returns do not reflect any fees, expenses or sales charges.
Active management does not ensure gains or protect against market declines.
Equity securities are subject to price fluctuation and possible loss of principal.
Commodities and currencies contain heightened risk that include market, political, regulatory, and natural conditions and may not be suitable for all investors.
Small- and mid-cap stocks involve greater risks and volatility than large-cap stocks.
US Treasuries are direct debt obligations issued and backed by the “full faith and credit” of the US government. The US government guarantees the principal and interest payments on US Treasuries when the securities are held to maturity. Unlike US Treasuries, debt securities issued by the federal agencies and instrumentalities and related investments may or may not be backed by the full faith and credit of the US government. Even when the US government guarantees principal and interest payments on securities, this guarantee does not apply to losses resulting from declines in the market value of these securities.
Any companies and/or case studies referenced herein are used solely for illustrative purposes; any investment may or may not be currently held by any portfolio advised by Franklin Templeton. The information provided is not a recommendation or individual investment advice for any particular security, strategy, or investment product and is not an indication of the trading intent of any Franklin Templeton managed portfolio. Past performance does not guarantee future results.
Any data and figures quoted in this article (unless stated) are sourced from FTSE Russell, FactSet, Bloomberg and Reuters.
Important data provider notices and terms available at www.franklintempletondatasources.com. All data is subject to change.
WF: 12016008